
SMH. VanEck Semi Conductor Sector.
SPY. State Street S&P 500.
IWX. iShares Russell Top 200 Value.
SCHD. Schwab US Dividend Equity.
XLE. State Street Energy Select Sector.
**All performance is YTD as of 10/22/2026. Performance is price only, excludes distributions.
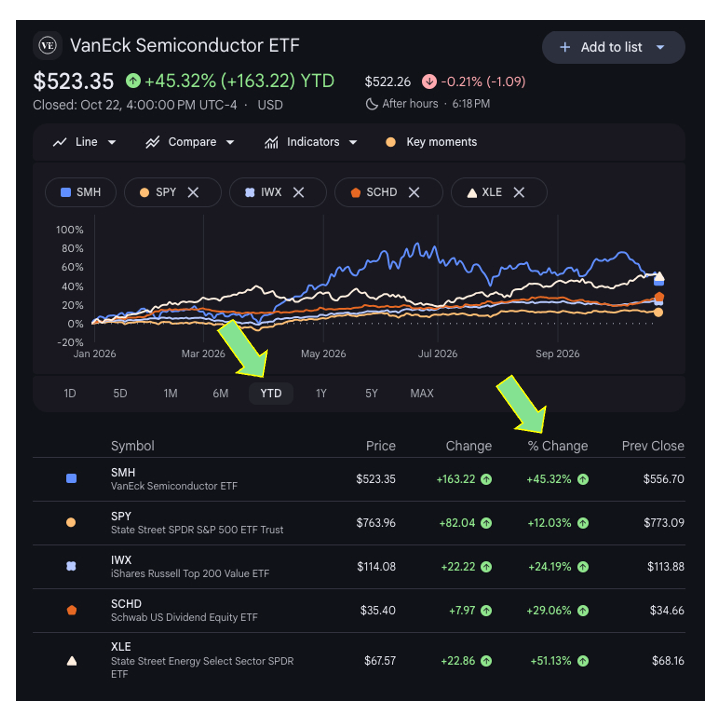
1. SMH. VanEck Semi Conductor Sector. SMH is up 45% YTD.
SMH is an example of the leading edge for the AI multi-hundred billion dollar cap ex build out. AI’s need for semiconductors is unprecedented. The incredible profitability of this sector is a direct transfer of cash leaving the balance sheet of the MAG7 hyper scalers into the pockets of the semiconductor companies. Whoever spends the most wins (narrative of the hyper scalers) and SMH represents some of the biggest beneficiaries. This will last forever (sarcasm) until it ends – badly. I don’t know when it ends…no WLA exposure to SMH.
SMH is down almost 20% this month, down about 6% on Oct 22nd alone (one day!)
SMH is still up 45% YTD. Entry points matter.
2. SPY. State Street S&P 500. SPY is up 12% YTD.
Like I characterized in my commentary two weeks ago, “Multiple Market Crises; SPY unchanged”. The large cap US indices are hiding significant stock and sector specific down-side risk in real time. The AI craze is driving all the performance in the S&P500 for 2026.
3. IWX. iShares Russell Top 200 Value. IWX is up 24% YTD.
IWX is the largest holding in my firm – not the SPY. I consider IWX a cleaner version of the US equity market vs the SPY – Less MAG7, Less Tech, More Energy and other Defensives. IWX is well ahead of the SPY this year…Value out-performing Growth by a huge margin – after a more than a decade of Growth leadership. For MAG7 exposure I’ve been focused on S&P 100 ETFs (market cap or equal weighted, OEF or EQWL).
4. SCHD. Schwab US Dividend Equity. SCHD is up 29% YTD.
SCHD – I describe the exposure SCHD provides as the “old economy”, healthcare, energy, staples, financials, REITs, utilities – the boring stuff you need to live. It’s been on a tear for over a year now – amazing performance. Who would have guessed? WLA’s second largest holding.
5. XLE. State Street Energy Select Sector. XLE is up 51% YTD.
XLE is essentially Exxon and Chevron (the two largest weights). Energy costs are another “higher for longer”. WLA established its position in Energy well before the Iran hostilities – Energy is under-represented in the S&P500, XLE is great diversification, attractive income and inflation protection. Energy is the only sector outperforming Tech in 2026 and is probably still under owned in a typical retail or institutional portfolio. It’s hard to buy more XLE today at these levels – Energy is also a decent amount of exposure within IWX and SCHD (Energy is a larger sector exposure in IWX and SCHD than the S&P500’s paltry 3-4% sector weight).
Summary:
--If you own all 5 of these you’re having a great year.
--If you’re chasing market tops – you’re getting beaten up.
--Stock specific draw-downs of 10 – 20% or more from the 2026 tops are everywhere within the US Equity market – just NOT at the index level. It’s pretty incredible to see the volatility happening under the surface.
--I’ve been allocating to the interest rate sensitive sectors that got sold off in recent months like Utilities, Industrial REITs and 1 – 5 Year Treasury Bonds.
--Overall, WLA portfolios are keeping up with the market with less risk for 2026.
Best,
Jon Fritzinger
Not investment advice. Above performance figures are not representative of WLA client results, WLA client performance is based on different time periods among other factors. Actual client performance varies based on multiple factors including risk tolerance, when WLA was hired and when positions were established and the deduction of WLA ‘s management fees. WLA client holding period for the above examples varies, do not assume it’s the year to date period for any of the examples provided, it may be longer or shorter. Do not assume every WLA client holds every ETF example, client risk tolerance and when WLA was hired effects portfolio allocations. Read the disclosures on the ETF links provided. Performance listed is for illustration purposes only, not an endorsement to buy or sell. Do you own research and/or discuss with a professional investment advisor. Read full disclosures located in this email and at www.westernlevel.com.
The ETF links for more information and complete disclosures.
https://www.vaneck.com/us/en/investments/semiconductor-etf-smh/overview/
https://www.ssga.com/us/en/intermediary/etfs/state-street-spdr-sp-500-etf-trust-spy
https://www.ishares.com/us/products/239722/ishares-russell-top-200-value-etf
https://www.schwabassetmanagement.com/products/schd
https://www.ssga.com/us/en/intermediary/etfs/state-street-energy-select-sector-spdr-etf-xle